Pandas Dataframes
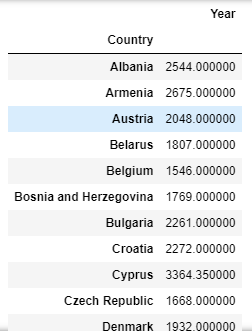
Let’s see how we can use the Group By function in a pandas dataframe, similar to GROUP BY in SQL
Code:
import pandas as pd
df = pd.read_excel('europe_cities_by_sunshine.xlsx')
df = df[['Country', 'Year']]
df = df.groupby(by=["Country"]).mean()
Explanation:
Here, note we only select the Country and Year columns from the Excel sheet for a simple example. Then we use the groupby function built into pandas, and saying we want to group by the Country column. So, if we have 2 rows for UK cities (London and Manchester for ex), the group by function will combine those 2 rows into 1 single row for the UK. Then, we have to say what to do with the data for the London and Manchester Year column, which is what the “.mean()” function does, it calculates the mean value for number of hours of sun the 2 UK cities get and returns that value on one single row for the UK. It’s exactly the same as GROUP BY in SQL, with the AVG() aggregation.
