Graphing Charts in Python
Python Charts
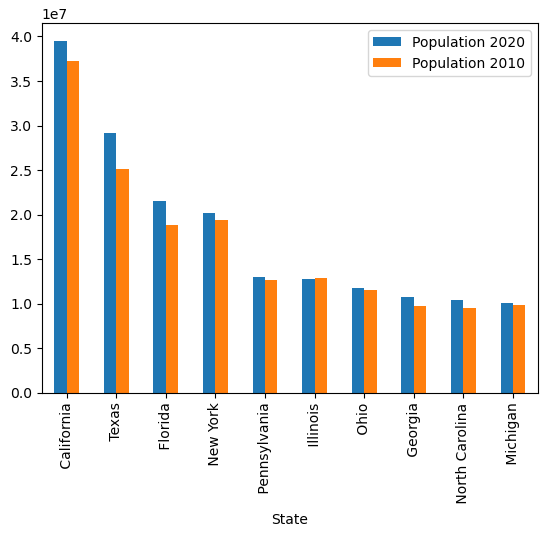
Say we’d like to compare the Population in 2010 vs 2020 for the top US cities:
Code:
import pandas as pd
df = pd.read_excel('us_population_change_2020.xlsx')
df = df.head(10)
ax = df.plot(x="State", y=["Population 2020", "Population 2010"], kind="bar")
Explanation:
Now, we’re going to read in the Excel file, get the top 10 rows, and in the 3rd line, specify which column names we’d like to specifically plot, along with the type of chart type (kind = “bar”).
