Graphing Charts in Python
IN THIS LESSON
Python Line Charts
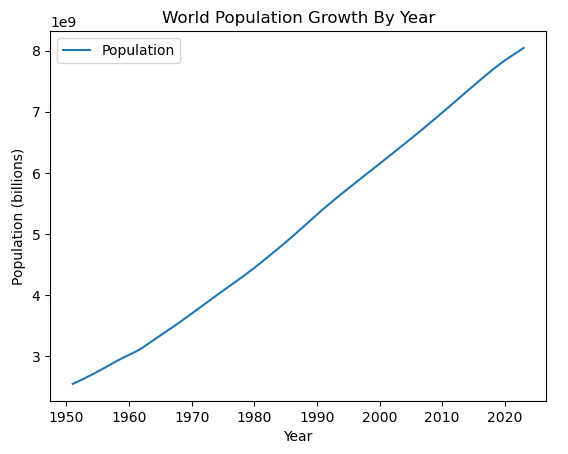
Adding a title is simple as well with a single line of code, and we’ll dive in later to further customize your title.
Code:
import pandas as pd
df = pd.read_excel('world_population_growth.xlsx')
df.plot( 'Year' , 'Population' )
plt.xlabel('Year')
plt.ylabel('Population (billions)')
plt.title('World Population Growth By Year')
Explanation:
The plt.title() function is a simple way to explain your data.
-
Add a short summary or a list of helpful resources here.
