Graphing Charts in Python
Python Charts
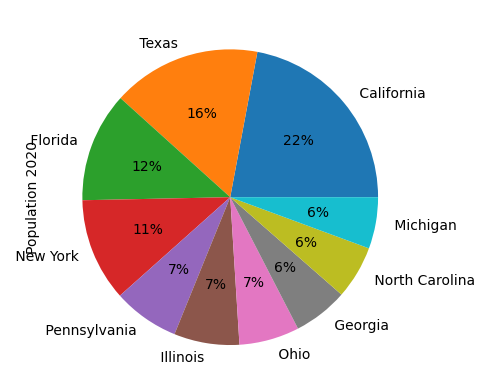
Let’s add data labels to the pie chart for easier reading
import pandas as pd
df = pd.read_excel('us_population_change_2020.xlsx')
df = df.head(10)
df.plot(kind='pie', y='Population 2020', labels=df['State'].tolist(), legend=False, autopct='%1.0f%%')
Explanation:
The line with autopct indicates how to display the percent value above with a full number.
