Pandas Dataframes
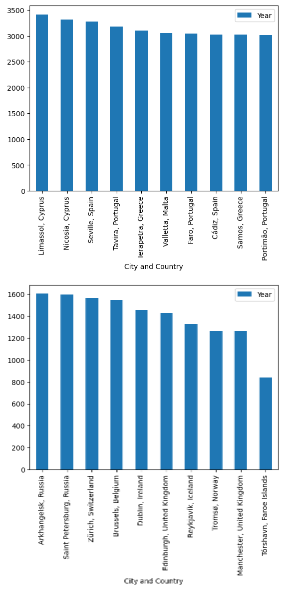
Let’s visually see the top and bottom Cities from the Europe dataset on sunshine rankings:
Code:
import pandas as pd
df = pd.read_excel('europe_cities_by_sunshine.xlsx')
df['City and Country'] = df['City'] + ', ' + df['Country']
df_top = df.sort_values('Year', ascending=False).head(10)
df_bottom = df.sort_values('Year', ascending=False).tail(10)
ax = df_top.plot(x="City and Country", y=["Year"], kind="bar")
ax2 = df_bottom.plot(x="City and Country", y=["Year"], kind="bar")
Explanation:
We can see here we create 2 dataframes, dftop which gets the top 10 rows when sorting by the amount of sunshine in a year (the Year column) and another dataframe (df_bottom) with the last 10 rows of the dataframe. We then plot on two axes the 2 dataframes we created to quickly and visually see the data.
